Post title: Crack Propagation in a modified CT sample
Post subtitle: ANSYS APDL
Created on: 03 Sep 2019
Updated on: 26 Dec 2024
Code is available on: https://github.com/MikulaJakub/crack-growth-using-ANSYS-APDL.
In this post, I describe and share the algorithm (APDL macro) presented in my YouTube video demonstrating the crack growth in a modified CT sample written in ANSYS Mechanical APDL.
The algorithm I wrote is quite general and can be used to simulate crack growth in various 2D geometries. The crack angle is predicted based on the theory of the maximal tangential stress criterion (MTSC).
This work was done as part of my bachelor’s thesis at BUT (Brno University of Technology, Czech Republic) in 2012. The thesis (written in Slovak language can be freely downloaded from https://www.vutbr.cz/en/students/final-thesis?zp_id=49360 the university’s database.
Background
Theory
High-cycle fatigue can be generally divided into three crack-life stages: crack nucleation, crack growth, and eventually brittle failure. Here, I focus on the second stage - stable crack growth. Under certain conditions, the crack growth can be described by the Paris-Erdogan law (logarithmically linear dependence between the number of cycles and the stress intensity factor \(K\)). Predictions of the lifetime (number of cycles) of a sample with a pre-existing crack or predictions of the crack path are of crucial importance in assessing the conditions of engineering structures subjected to cyclic loading, such as shafts, switches and others. Furthermore, the ability to predict the crack path using computer simulations allows one to optimize the structure geometry with pre-existing cracks with an effort to prevent the failure.
Aims
The aim is to write an APDL script which can be used to model the crack growth in an arbitrary 2D geometry in ANSYS Mechanical APDL using the plane elements. The employed theory is based on the assumptions of the linear elastic fracture mechanics (LEFM).
Algorithm
In this approach, the crack surfaces are modelled explicitly at each time step (crack increment) and the geometry (crack propagation zone) is (re-)meshed at each time step too. Although the remeshing approach may not (in terms of computational time) be very efficient when modelling a crack growth, it does the job.
The crack angle at each iteration is predicted from the stress intensity factors \(K_I\) and \(K_{II}\) calculated from the displacement field near the crack tip (Erdogan and Sih 1963), (employing the special element property that models the crack singularity by shifting the element nodes to one-quarter of the element length):
\[\theta = 2\arctan \left(\frac{1}{4}\frac{K_I}{K_{II}} \pm \frac{1}{4}\sqrt{\left(\frac{K_I}{K_{II}}\right)^2+8}\right)\]
where the stress-intensity factors are calculated from the crack tip nodal displacements (see ANSYS’s documentation)
\[\begin{split}K_I &= \frac{E}{3(1+\mu)(1+\kappa)}\sqrt{\frac{2\pi}{L}} \left[4(v_2-v_4)-\frac{v_3-v_5}{2}\right]\\ K_{II} &= \frac{E}{3(1+\mu)(1+\kappa)}\sqrt{\frac{2\pi}{L}}\left[4(u_2-u_4)-\frac{u_3-u_5}{2}\right]\end{split}\tag{1}\]
where \(\kappa=3-4\mu\) for plane stress and \(\kappa=(3-\mu)/(1+\mu)\) for plane strain.
Demonstration
Here, I demonstrate how to prepare the geometry and run the code to predict the crack path. This demo was tested with Mechanical APDL 2019 R2 (Academic version - limited to 32000 nodes).
Geometry
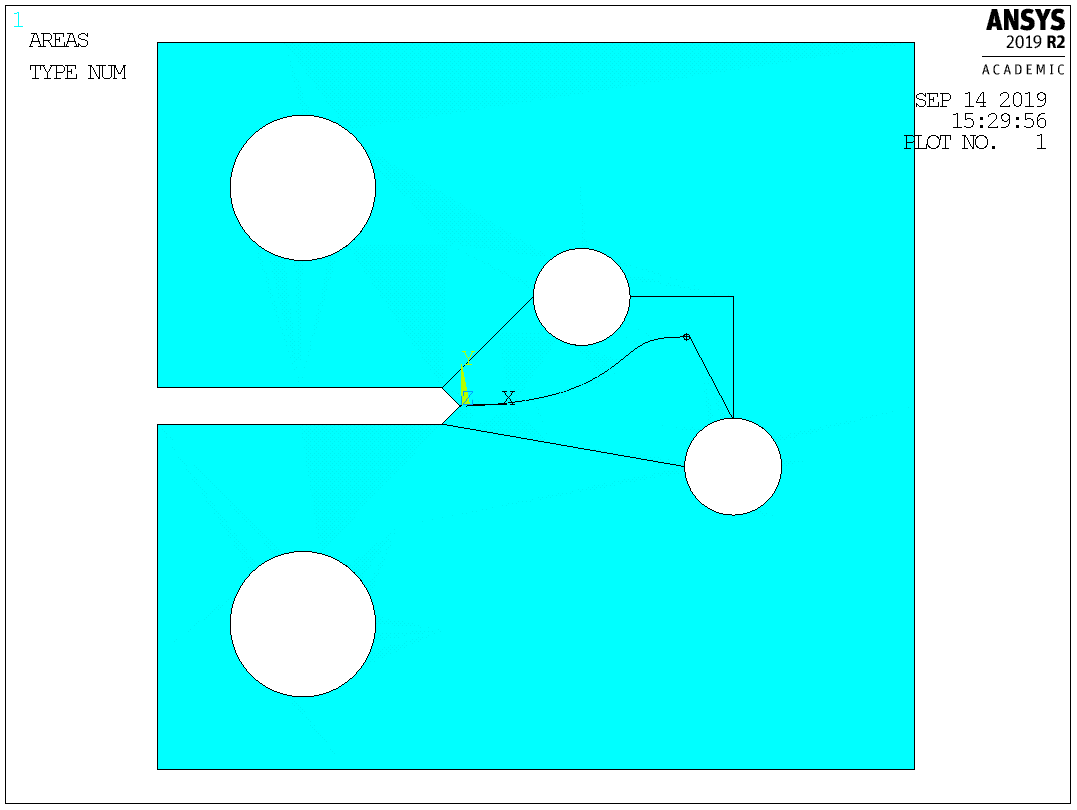
First, create the desired geometry model in 2D. As an example I choose the following 2D modified CT sample illustrated in the YouTube video.
Notice that the geometry has to contain an area (in this case A3 shown in the figure below) in which the crack is expected to propagate. This area will be (re)-meshed automatically. The keypoint of the crack initiation (KP = 27) and the expected final crack position (KPe = 33) have to be defined on the boundary (NOT within). The size of the crack propagation zone (A3) and the choice of the keypoint of the expected final crack position do not influence the result; however, they influence the efficiency (time to remesh) and stability of the solution.
The code to generate this geometry is provided below:
!(c) 2019, Jakub Mikula
!mikula_jakub@centrum.sk

FINISH
/clear
/prep7

L = 62.5
H = 60.0
R1 = 6.0
R2 = 4.0

k
k,,L
k,,L,H
k,,,H

l,1,2
l,2,3
l,3,4
l,4,1

k,,2*R1,2*R1
k,,2*R1,H-2*R1
k,,L-15,H/2-5
k,,L-27.5,H/2+9

circle,5,R1
circle,6,R1
circle,7,R2
circle,8,R2

k,,,H/2+1.5
k,,L-37.5-1.5,H/2+1.5
k,,L-37.5,H/2
k,,L-37.5-1.5,H/2-1.5
k,,,H/2-1.5

! expected area of crack growth
l,25,26
l,26,27
l,27,28
l,28,29
l,29,25

l,26,23
l,28,19

k,,L-15,H/2+9
l,18,30
l,30,21

! create areas from lines
al,1,2,3,4
al,21,22,23,24,25
al,22,23,27,14,28,29,20,19,26
al,19,20,17,18
al,15,16,13,14
al,5,6,7,8
al,9,10,11,12

APTN,ALL    !area partition
adele,7     !make holes
adele,6
adele,4
adele,5
adele,2

! finite element
ET,1,82
KEYOPT,1,3,2 !plane strain conditions

! isotropic elasticity
MP,EX,1,210000
MP,PRXY,1,0.3

LESIZE,27,1
LESIZE,14,1
LESIZE,28,1
LESIZE,29,1
LESIZE,20,1
LESIZE,19,1
LESIZE,26,1
LESIZE,22,1
LESIZE,23,1

LESIZE,1,5
LESIZE,2,5
LESIZE,3,5
LESIZE,31,5
LESIZE,30,5

AMESH,8
! The area with the crack will (re)mesh automatically

! boundary conditions
DK,14,,,,0,UX
DK,12,,,,0,UX
DK,12,,,,0,UY
FK,14,FY,100 !100 N force


! divide lines
LDIV,      22,  0.5
LDIV,      23,  0.5
LDIV,      14,  0.01

LDELE,25

! end of macro
Running the macro
- Download and copy the macro below into your home directory (usually This PC > OS(C:) > Users > your_username) with the filename MTSC.mac:
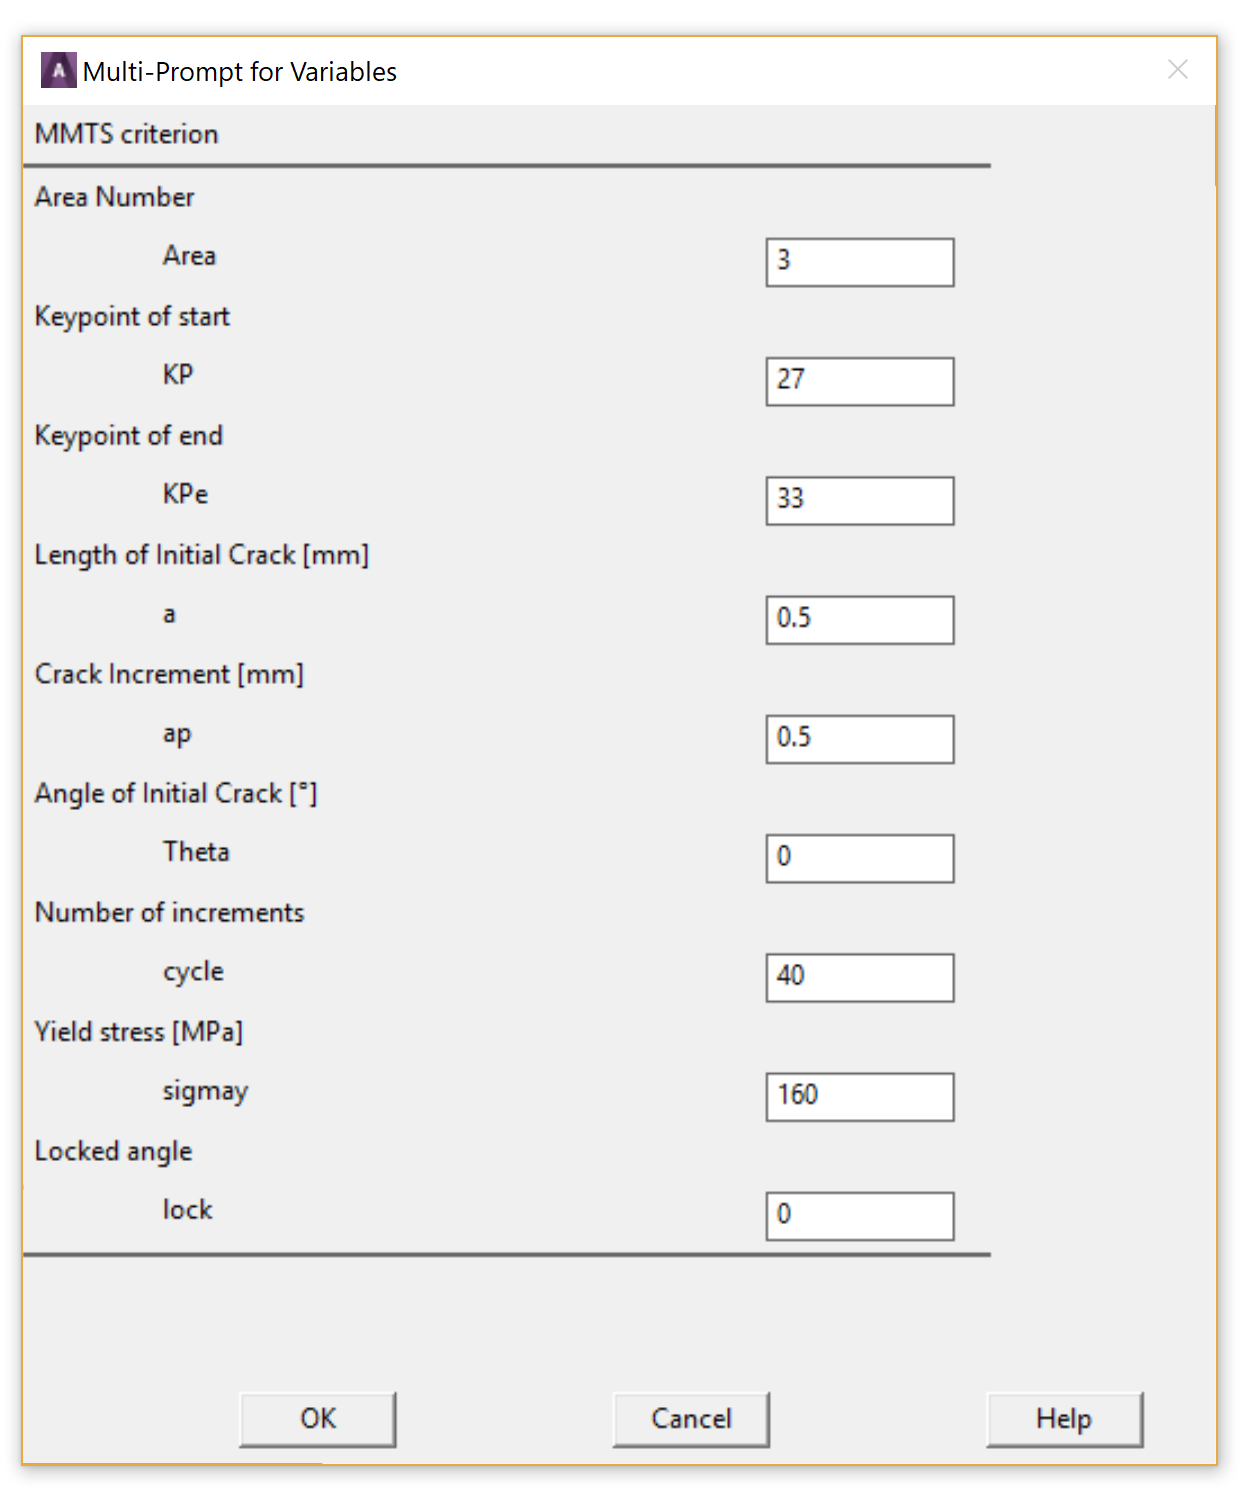
- Type MTSC in the ANSYS’s command line to call the macro. - The following window will appear.

- Fill in the numbers as shown in the figure. Later you can explore the sensitivity of the crack increment \(a\) on the crack path.
This code has been most recently tested with ANSYS Mechanical APDL 2019 R2 (Student Version - limited mesh size) and some older versions.
Note: I had to modify the original code to make it compatible with this new version of ANSYS. I noticed that ’SET, LAST’ is necessary to include to read the last set of results before one can plot the solution nodal data.
Analysing the results
The final geometry is shown in the figure below.

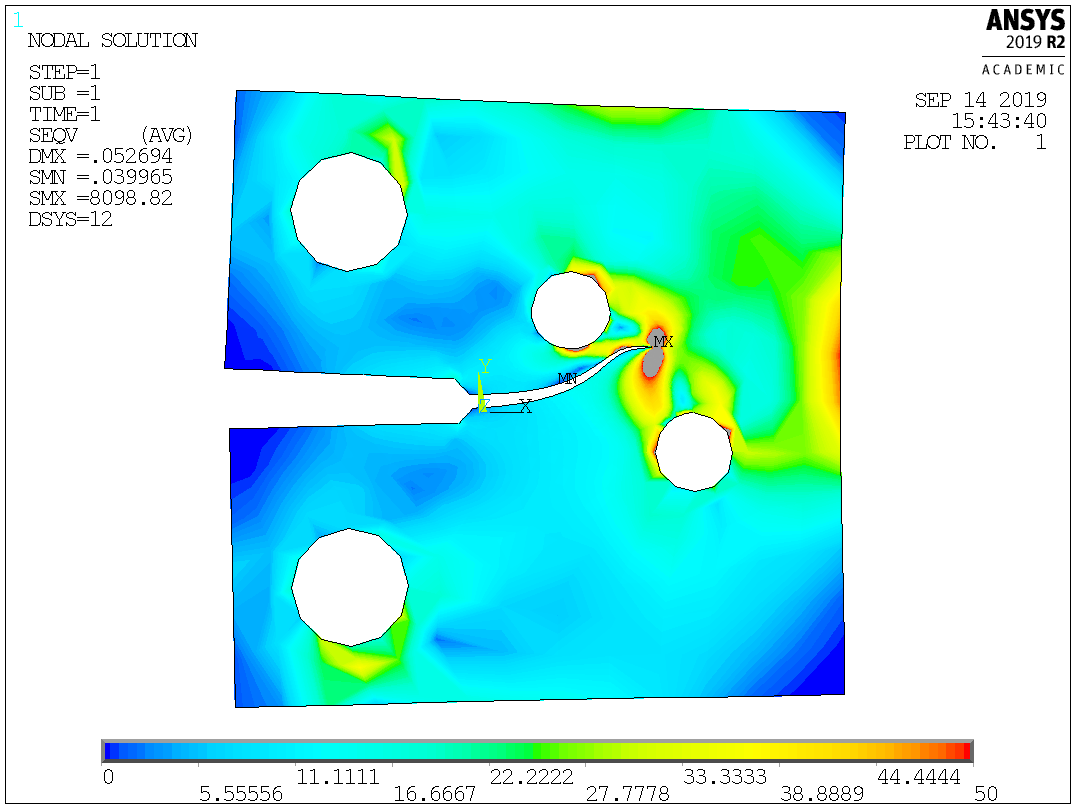
The following figure shows the distribution of the Von-Mises stress in the interval 0-50MPa. The high stress concentration (theoretically \(\boldsymbol{\sigma} \rightarrow \infty\)) can be noticed near the crack tip.

FAQ
Feel free to use, share and modify the code to your needs. While there is a lot to improve, I hope the algorithm will provide some inspiration on how to approach solving such problems. If you use the code, please cite the following thesis:
Note that this code was written quite some time ago (y. 2012), and therefore there remains a lot to be improved. Also note that the Academic version may crash when the number of the generated nodes at any iteration reaches more than 32000!
References
Erdogan, F., and G. C. Sih. 1963. “On the Crack Extension in Plates Under Plane Loading and Transverse Shear.” Journal of Basic Engineering 85 (4): 519–25. https://doi.org/10.1115/1.3656897.